Body Mass Index: Calculate your BMI | Charts Complete Guide
The Ultimate BMI Calculator
Advanced BMI & Health Calculator
Your saved progress will appear here.
Ready to Take the Next Step?
Your result is a great starting point. For a personalized diet plan that fits your unique body and goals, connect with DietArch founder and Certified Nutritionist, Sara Ali.
Get Your Custom Diet PlanDisclaimer: This calculator is for informational purposes only and is not a substitute for professional medical advice. Always consult a healthcare provider for a complete health assessment.
Body Mass Index (BMI)
Body Mass Index (BMI) is a health screening tool approved by the World Health Organization (WHO). It uses a simple formula to measure your weight in relation to your height, giving a single number that helps you check your weight status.
The calculation is your weight (in kilograms) divided by the square of your height (in meters).
Health professionals use BMI because it is a reliable indicator of body fatness for most people. It is trusted all over the world as it is strongly linked with the risk for certain health conditions. It is a quick and effective way to assess your health from a broad perspective.
Calculate your macronutrient split with our macro calculator.
What does BMI tell you?
BMI is a simplest way to check if your weight is healthy for your height. It gives you a number that falls into a category:
BMI Range | Category | |
|---|---|---|
Below 16 | Severely underweight | |
16 – 17 | Moderately underweight | |
17 – 18.5 | Slightly underweight | |
18.5 – 25 | Normal (Healthy) | |
25 – 30 | Overweight | |
30 – 35 | Obesity Class 1 | |
35 – 40 | Obesity Class 2 | |
Above 40 | Obesity Class 3 |
Example:
A healthy BMI is between 18.5 and 25. For a person who is 5’10”, a healthy weight would be between about 129 and 174 pounds.
Check what should be your Ideal Body Weight.
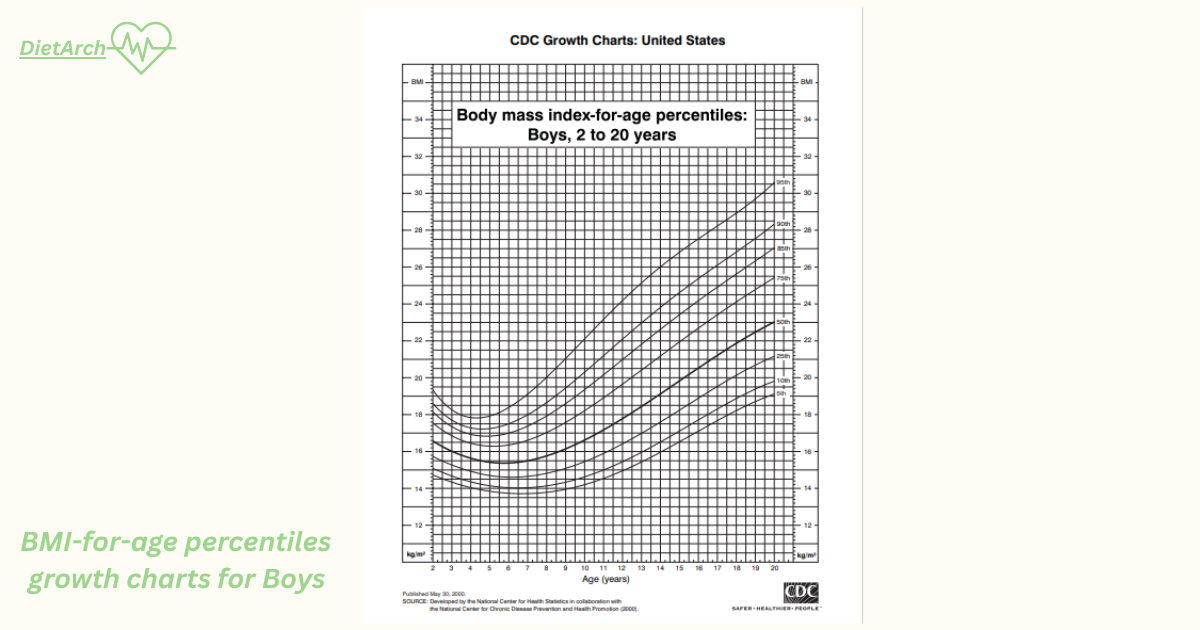
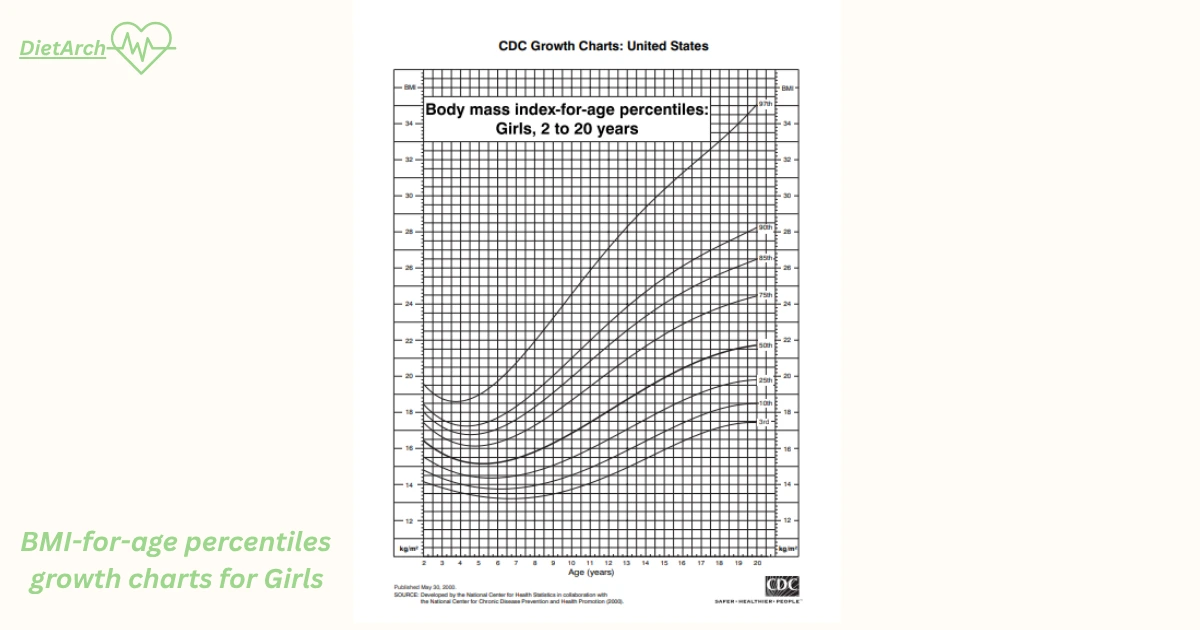
BMI Table for Children and Teens (Ages 2–20)
For kids and teenagers, BMI works a bit differently than it does for adults. Instead of using fixed numbers, doctors look at percentiles based on age and gender.
Category | What It Means | |
|---|---|---|
Underweight | Below the 5th percentile – The child is too thin for their age and height. | |
Healthy weight | Between the 5th and 85th percentile – This is considered a healthy, normal weight. | |
At risk of overweight | Between the 85th and 95th percentile – The child may be gaining too much weight. | |
Overweight | Above the 95th percentile – The child is heavier than what’s healthy for their age and height. |
This system helps doctors and parents track a child’s growth and make sure their weight is in a healthy range as they grow. Percentiles compare a child’s BMI to others of the same age and gender.
BMI chart for children and teens
BMI-for-age percentiles growth charts for Boys
BMI-for-age percentiles growth charts for Girls
BMI Charts for Adults
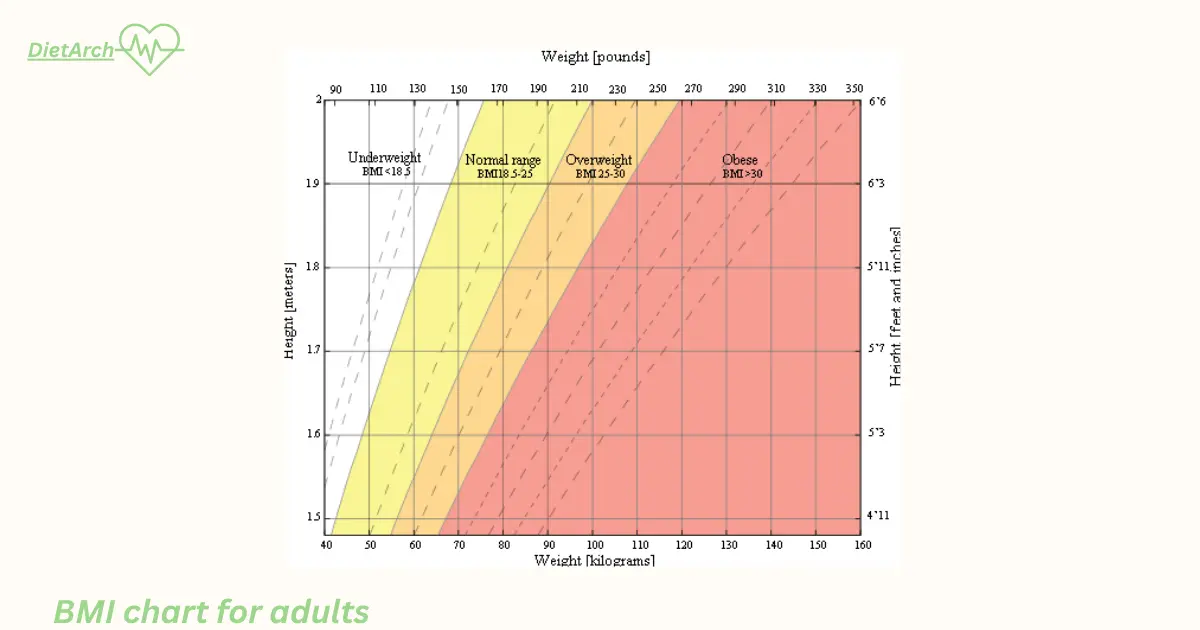
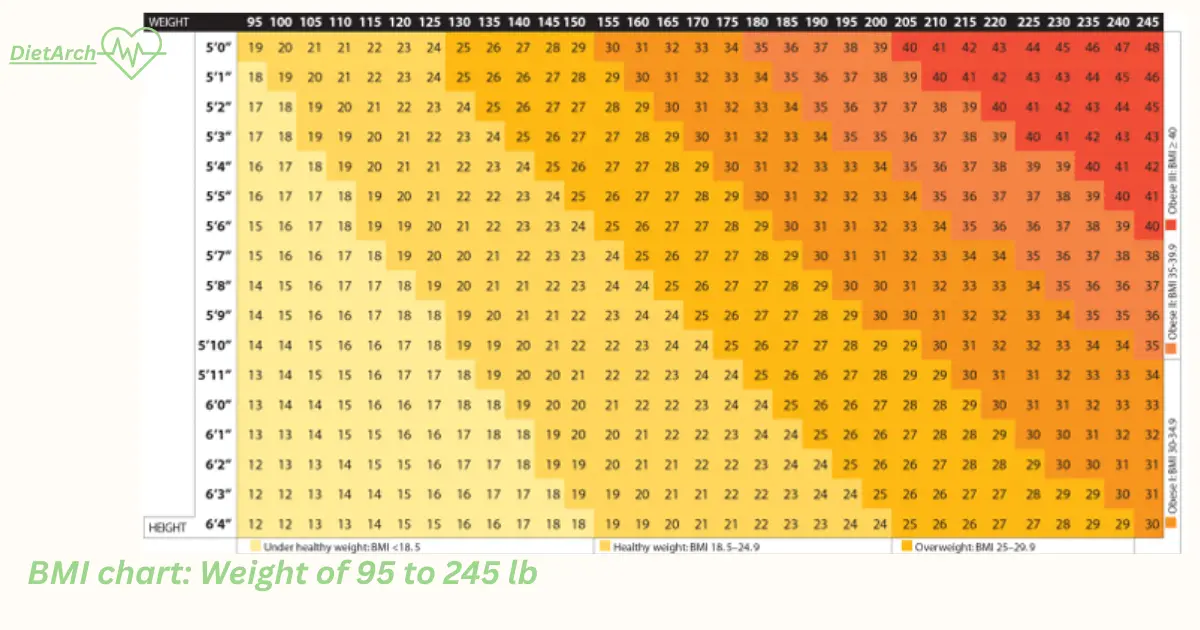
BMI (Body Mass Index) charts enable a person to check its health status. There are two types of charts.
If you weigh 245 lb or less, use the first chart.
If you weigh more than 250 lb, use the second chart.
The shaded areas show if your BMI is:
In the healthy range
Overweight
Or in one of the obesity categories
Class 1 obesity: BMI between 30 and 34.9
Class 2 Obesity: BMI between 35 and 39.9
Class 3 (Severe Obesity): BMI 40 or higher
Read the one habit to reduce visceral fat.
BMI chart: Weight of 95 to 245 lb
BMI chart: Weight of 250 to 400 lb
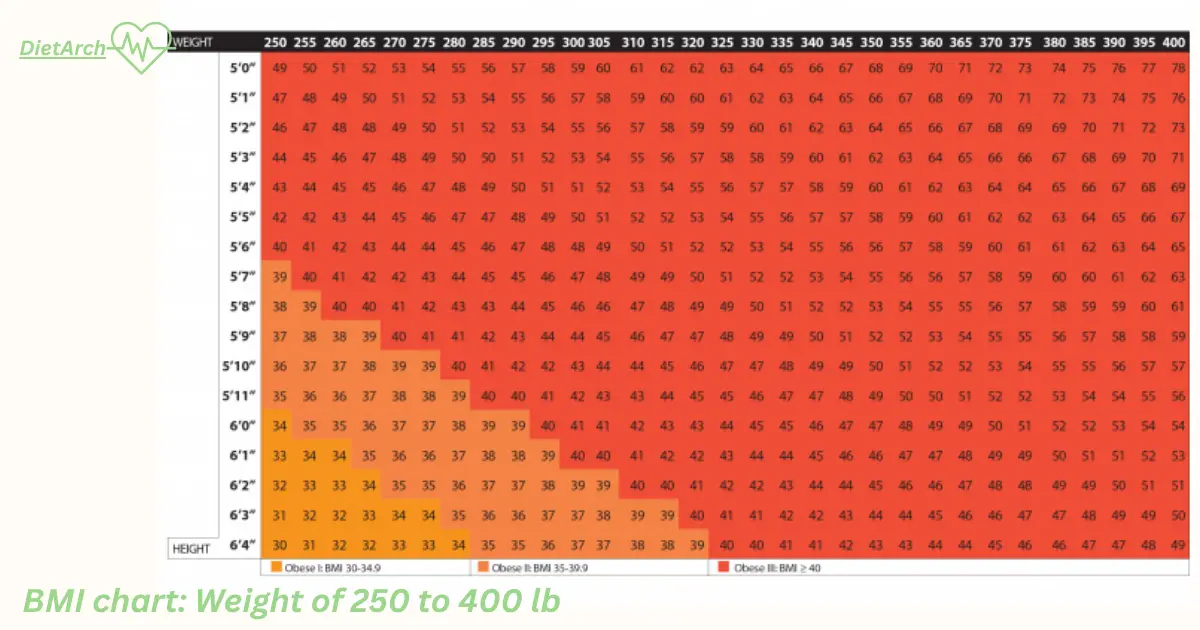
These charts are based on a BMI guide developed by the University of Vermont.
Why is BMI important?

BMI helps you know if your weight is suitable for your body. It is not completely perfect but it is good enough to make an estimation. If your Body Mass Index is too low or too high, it is better to take your health seriously.
Calculate your body fat percentage for free.
Health Risks of Being Overweight
Carrying extra pounds can be a reason of serious health problems. According to health experts, being overweight puts extra burden on body and increases the chances of developing the following conditions:
Reduce risk of stroke with these habits.
Health Risks of Being Underweight
While it is less talked about, being underweight can also affect your health in many serious ways. It means your body is not geining the right weight with the nutrients and energy it needs to function properly. Risks include:
Check other health tools and calculators for further health assessment.

Limitations of BMI:
Although BMI (Body Mass Index) is a common and useful tool for checking whether a person’s weight is in a healthy range. It does not completely explain health status. It’s just a rough estimate and does not show all factors that make up a person’s body composition.
For Adults: BMI will not distinguish between fat, muscle, bone, and water weight. Therefore, two individuals can have identical BMI but different body composition. Following are identical limitations of BMI:
For Children and Adolescents: For increasing children, factors that extend beyond weight come into play. Growth phases, puberty, and development all influence body shape and composition.
What else does the BMI calculator show?
Along with BMI, it may also show:
Body Mass Index (BMI): Calculation Methods
BMI, or Body Mass Index, is a standardized method used to check whether a person weight is within a healthy range relative to their height. It applies across both metric and imperial systems.
BMI Calculation Formulas
Using US Customary Units (USC):
To calculate BMI with pounds and inches given the following formula is applied:
Example:
For an individual who is 5 feet 10 inches (70 inches) tall and weighs 160 pounds:
Using Metric Units (SI):
Using kilograms and meters, the calculation is:
BMI =
Weight (kg)
[Height (m)]2
Example:
For an individual who weighs 72.57 kg and is 1.778 meters tall:
BMI = Weight (kg) / [Height (m)]2
BMI = 72.57 / 1.7782 = 23
BMI Prime
BMI Prime is a ratio of individual’s BMI to top of range of BMI, and it is a range of healthy weight. It is usually defined as 25 kg/m² by institutions such as the WHO and CDC.
It is a unitless quantity and provides an instant reference to see how far an individual’s BMI is from the top end of the normal range.
Interpretation of BMI Prime Values:
BMI Prime | Weight Category | |
|---|---|---|
< 0.64 | Severe Thinness | |
0.64 – 0.68 | Moderate Thinness | |
0.68 – 0.74 | Mild Thinness | |
0.74 – 1.00 | Normal Weight | |
1.00 – 1.20 | Overweight | |
1.20 – 1.40 | Obesity Class I | |
1.40 – 1.60 | Obesity Class II | |
> 1.60 | Obesity Class III |
Ponderal Index (PI)
The Ponderal Index also calculates body composition but is more accurate for height as it takes a cubed height value instead of squared. It is considered more suitable for individuals at the extreme ends of the height spectrum, where BMI may be less accurate.
PI Calculation Formulas
Using US Customary Units:
Example:
For someone 70 inches tall and 160 pounds:
Using Metric Units:
Example:

