Ideal Body Weight Calculator
Ideal Body Weight Calculator
Fill in your details to generate your comprehensive health assessment.
Advanced Details (optional)
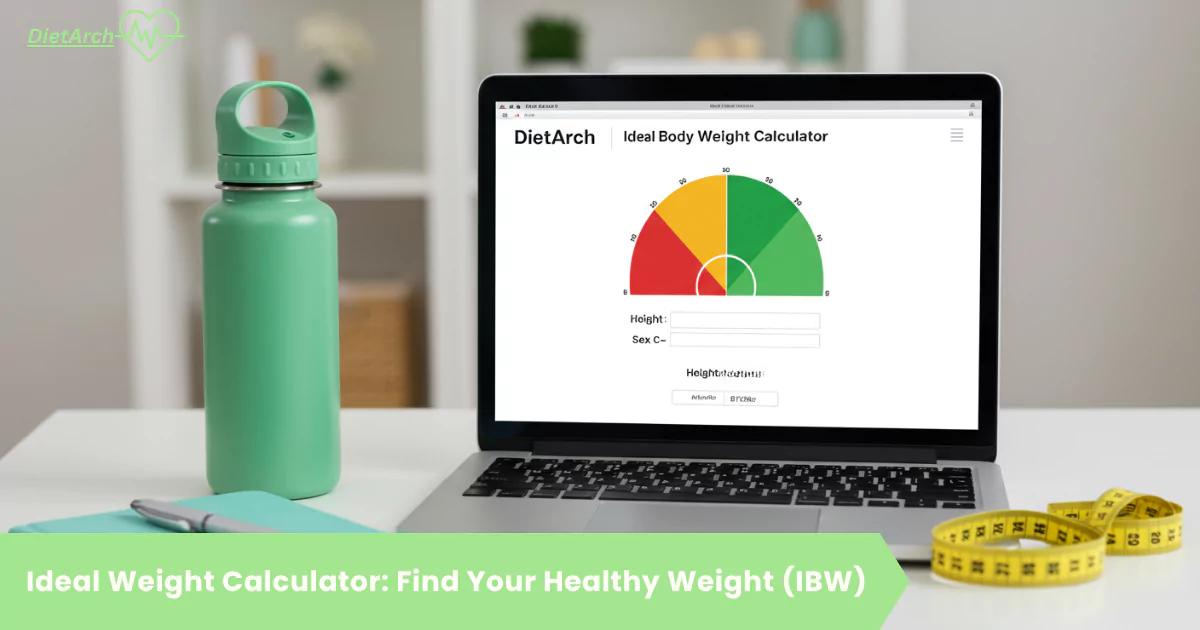
This ideal body weight calculator compares all four clinical formulas, not just one, and adjusts the answer for your frame size. Enter your height, sex and wrist size once to see your healthy range in kilograms and pounds.
Most calculators hand you a single number from a single formula. This guide shows you why that number moves, which formula deserves your trust, and how frame, muscle and age shift the range that is healthy for you.

Your Result Explained: A Range, Not a Single Number
Your body does not have one perfect weight. It has a healthy range, and every method inside this ideal body weight calculator is a different way of estimating where that range sits for your height.
The primary answer is the healthy BMI range: the weight band that puts your body mass index between 18.5 and 24.9. The four formulas then act as a cross-check, because each one was built from different population data.
If the formulas and the BMI range roughly agree, you have a solid target zone. Where they disagree, the sections below explain how the ideal body weight calculator weighs each method and which one to trust.
Ideal Body Weight Chart by Height
The chart below answers "what is my ideal weight" for every height, without running the tool. Find your height to read your healthy range in kilograms first, then pounds. These are the same ranges the ideal body weight calculator uses.

| Height | Height (cm) | Healthy weight range (kg) | Healthy weight range (lb) |
|---|---|---|---|
| 4 ft 10 in | 147 | 40.2-54.0 | 89-119 |
| 4 ft 11 in | 150 | 41.5-55.9 | 92-123 |
| 5 ft 0 in | 152 | 43.0-57.8 | 95-127 |
| 5 ft 1 in | 155 | 44.4-59.8 | 98-132 |
| 5 ft 2 in | 157 | 45.9-61.8 | 101-136 |
| 5 ft 3 in | 160 | 47.4-63.8 | 104-141 |
| 5 ft 4 in | 163 | 48.9-65.8 | 108-145 |
| 5 ft 5 in | 165 | 50.4-67.9 | 111-150 |
| 5 ft 6 in | 168 | 52.0-70.0 | 115-154 |
| 5 ft 7 in | 170 | 53.6-72.1 | 118-159 |
| 5 ft 8 in | 173 | 55.2-74.3 | 122-164 |
| 5 ft 9 in | 175 | 56.8-76.5 | 125-169 |
| 5 ft 10 in | 178 | 58.5-78.7 | 129-174 |
| 5 ft 11 in | 180 | 60.2-81.0 | 133-179 |
| 6 ft 0 in | 183 | 61.9-83.3 | 136-184 |
| 6 ft 1 in | 185 | 63.6-85.6 | 140-189 |
| 6 ft 2 in | 188 | 65.4-88.0 | 144-194 |
| 6 ft 3 in | 191 | 67.1-90.4 | 148-199 |
| 6 ft 4 in | 193 | 68.9-92.8 | 152-205 |
| 6 ft 5 in | 196 | 70.8-95.2 | 156-210 |
| 6 ft 6 in | 198 | 72.6-97.7 | 160-215 |
Two things stand out in the chart. The range widens as height rises, because the same BMI band covers more kilograms on a taller frame.
The range is also wide on purpose. At 5 ft 8 in, healthy runs from 55.2 kg to 74.3 kg, which is why a single formula number should never be treated as a pass or fail line. The ideal body weight calculator at the top of this page personalises the same chart with your frame size, and for a printable, chart-only view of the data, see our healthy weight chart page.
The 4 IBW Formulas Compared
Every ideal body weight calculator is built on one or more of four formulas published between 1964 and 1983. They all start from a base weight at 5 feet and add a fixed amount for each inch above it.
| Formula | Year | Men: base at 5 ft, plus per inch | Women: base at 5 ft, plus per inch | Best used for |
|---|---|---|---|---|
| Devine | 1974 | 50 kg + 2.3 kg | 45.5 kg + 2.3 kg | Clinical dosing and the default health estimate |
| Robinson | 1983 | 52 kg + 1.9 kg | 49 kg + 1.7 kg | A refined cross-check on Devine |
| Miller | 1983 | 56.2 kg + 1.41 kg | 53.1 kg + 1.36 kg | Heights where Devine reads low |
| Hamwi | 1964 | 48 kg + 2.7 kg | 45.5 kg + 2.3 kg | Frame size adjustments |
Devine Formula (1974): The Clinical Standard
Devine is the formula hospitals use to dose medication, and the one most tools default to. Men start at 50 kg and women at 45.5 kg, with 2.3 kg added per inch over 5 feet.
If you remember only one formula, make it this one. The ideal body weight calculator above leads with Devine and shows the other three as a comparison.
Robinson Formula (1983)
Robinson rebuilt the estimate from newer insurance data and softened the per inch increase, especially for women. Its results sit close to Devine at average heights, which makes it a useful second opinion rather than a rival answer.
Miller Formula (1983)
Miller starts from the highest base weight of the four and adds the least per inch. That flat slope means Miller reads high for shorter adults and converges with the others as height rises.
Hamwi Formula (1964): The Frame Size Formula
Hamwi is the oldest formula and the only one designed to work with frame size. Its men's slope is the steepest of the four, and it is the formula the frame adjustment rule further down this page is built on.
The two tables below print every formula result by height, in kilograms. Use them to see the spread at your height before deciding which number to trust.
Men: ideal body weight by height, all 4 formulas (kg)
| Height | Devine | Robinson | Miller | Hamwi |
|---|---|---|---|---|
| 4 ft 10 in | 45.4 | 48.2 | 53.4 | 42.6 |
| 4 ft 11 in | 47.7 | 50.1 | 54.8 | 45.3 |
| 5 ft 0 in | 50.0 | 52.0 | 56.2 | 48.0 |
| 5 ft 1 in | 52.3 | 53.9 | 57.6 | 50.7 |
| 5 ft 2 in | 54.6 | 55.8 | 59.0 | 53.4 |
| 5 ft 3 in | 56.9 | 57.7 | 60.4 | 56.1 |
| 5 ft 4 in | 59.2 | 59.6 | 61.8 | 58.8 |
| 5 ft 5 in | 61.5 | 61.5 | 63.3 | 61.5 |
| 5 ft 6 in | 63.8 | 63.4 | 64.7 | 64.2 |
| 5 ft 7 in | 66.1 | 65.3 | 66.1 | 66.9 |
| 5 ft 8 in | 68.4 | 67.2 | 67.5 | 69.6 |
| 5 ft 9 in | 70.7 | 69.1 | 68.9 | 72.3 |
| 5 ft 10 in | 73.0 | 71.0 | 70.3 | 75.0 |
| 5 ft 11 in | 75.3 | 72.9 | 71.7 | 77.7 |
| 6 ft 0 in | 77.6 | 74.8 | 73.1 | 80.4 |
| 6 ft 1 in | 79.9 | 76.7 | 74.5 | 83.1 |
| 6 ft 2 in | 82.2 | 78.6 | 75.9 | 85.8 |
| 6 ft 3 in | 84.5 | 80.5 | 77.4 | 88.5 |
| 6 ft 4 in | 86.8 | 82.4 | 78.8 | 91.2 |
| 6 ft 5 in | 89.1 | 84.3 | 80.2 | 93.9 |
| 6 ft 6 in | 91.4 | 86.2 | 81.6 | 96.6 |
Women: ideal body weight by height, all 4 formulas (kg)
| Height | Devine | Robinson | Miller | Hamwi |
|---|---|---|---|---|
| 4 ft 10 in | 40.9 | 45.6 | 50.4 | 40.9 |
| 4 ft 11 in | 43.2 | 47.3 | 51.7 | 43.2 |
| 5 ft 0 in | 45.5 | 49.0 | 53.1 | 45.5 |
| 5 ft 1 in | 47.8 | 50.7 | 54.5 | 47.8 |
| 5 ft 2 in | 50.1 | 52.4 | 55.8 | 50.1 |
| 5 ft 3 in | 52.4 | 54.1 | 57.2 | 52.4 |
| 5 ft 4 in | 54.7 | 55.8 | 58.5 | 54.7 |
| 5 ft 5 in | 57.0 | 57.5 | 59.9 | 57.0 |
| 5 ft 6 in | 59.3 | 59.2 | 61.3 | 59.3 |
| 5 ft 7 in | 61.6 | 60.9 | 62.6 | 61.6 |
| 5 ft 8 in | 63.9 | 62.6 | 64.0 | 63.9 |
| 5 ft 9 in | 66.2 | 64.3 | 65.3 | 66.2 |
| 5 ft 10 in | 68.5 | 66.0 | 66.7 | 68.5 |
| 5 ft 11 in | 70.8 | 67.7 | 68.1 | 70.8 |
| 6 ft 0 in | 73.1 | 69.4 | 69.4 | 73.1 |
| 6 ft 1 in | 75.4 | 71.1 | 70.8 | 75.4 |
| 6 ft 2 in | 77.7 | 72.8 | 72.1 | 77.7 |
| 6 ft 3 in | 80.0 | 74.5 | 73.5 | 80.0 |
| 6 ft 4 in | 82.3 | 76.2 | 74.9 | 82.3 |
| 6 ft 5 in | 84.6 | 77.9 | 76.2 | 84.6 |
| 6 ft 6 in | 86.9 | 79.6 | 77.6 | 86.9 |
Worked Example in Kg and Pounds
Take a man and a woman who are both 5 ft 8 in tall. The healthy BMI range for that height is 55.2 to 74.3 kg (122 to 164 lb).
The man's formula results are Devine 68.4 kg (150.8 lb), Robinson 67.2 kg, Miller 67.5 kg and Hamwi 69.6 kg. The woman's are Devine 63.9 kg (140.9 lb), Robinson 62.6 kg, Miller 64.0 kg and Hamwi 63.9 kg.
All eight numbers sit inside the healthy range, in a tight cluster. That cluster, not any single figure, is the honest answer an ideal body weight calculator can give you.
Body Frame Size: The Wrist Test
Two people of the same height can carry different healthy weights because their skeletons differ. Frame size is how this ideal body weight calculator accounts for that difference.
Start with the finger test: wrap your thumb and middle finger around your opposite wrist. If they overlap, your frame is small; if they just touch, medium; if they do not meet, large.
The finger test is only a screen. The wrist circumference tables below are the standard method, so if the two tests disagree, trust the tape measure.
Women: frame size by wrist circumference
| Height | Small frame | Medium frame | Large frame |
|---|---|---|---|
| Under 5 ft 2 in | Under 5.5 in (14.0 cm) | 5.5 to 5.75 in (14.0 to 14.6 cm) | Over 5.75 in (14.6 cm) |
| 5 ft 2 in to 5 ft 5 in | Under 6 in (15.2 cm) | 6 to 6.25 in (15.2 to 15.9 cm) | Over 6.25 in (15.9 cm) |
| Over 5 ft 5 in | Under 6.25 in (15.9 cm) | 6.25 to 6.5 in (15.9 to 16.5 cm) | Over 6.5 in (16.5 cm) |
Men: frame size by wrist circumference
| Height | Small frame | Medium frame | Large frame |
|---|---|---|---|
| Over 5 ft 5 in | 5.5 to 6.5 in (14.0 to 16.5 cm) | 6.5 to 7.5 in (16.5 to 19.1 cm) | Over 7.5 in (19.1 cm) |
The standard table only publishes a men's band for heights over 5 ft 5 in. Men below that height can still use the finger test and the percentage rule below, which works at any height.
How Frame Size Changes Your Ideal Weight
The adjustment rule is simple, and it applies to the Hamwi result. A medium frame uses the Hamwi number exactly as it stands.
A large frame adds 10 percent. A small frame subtracts 10 percent. The ideal body weight calculator applies this rule when you enter a wrist measurement.
For the 5 ft 8 in man in the worked example, Hamwi gives 69.6 kg. A large frame moves his target to 76.6 kg, and a small frame moves it to 62.6 kg: a 14 kg spread from skeleton alone.
Percent Ideal Body Weight and Adjusted Body Weight
Clinicians use two more numbers that most online tools skip. Both start from the result the ideal body weight calculator gives you.
Percent ideal body weight compares your actual weight with your IBW: actual weight divided by IBW, multiplied by 100. Dietitians read 90 to 110 percent as the usual acceptable band, while a result under 90 percent can flag undernutrition in a clinical setting.
Adjusted body weight exists for the opposite problem: setting calorie and protein targets when actual weight is far above IBW. The formula is AdjBW = IBW + 0.4 x (actual weight minus IBW), which credits only part of the extra weight.
Worked example: a man with a Devine IBW of 68.4 kg who weighs 82 kg sits at 120 percent of his IBW. His adjusted body weight is 68.4 + 0.4 x (82 minus 68.4) = 73.8 kg, and that 73.8 kg is the figure a dietitian would use to set his calorie target.
What Else Your Result Shows
Alongside the formulas, this ideal body weight calculator reports five related measures. Each one has its own page on this site, because each deserves more than a passing number.
Body mass index. Your BMI places you in the WHO adult categories and sets the healthy range used throughout this page. Our BMI calculator page carries the full category table and the height by weight charts.
Body fat percentage. The formulas estimate weight, not composition. Our body fat calculator uses tape measure and formula methods to estimate what share of your weight is fat.
Waist-to-hip and waist-to-height ratios. These two ratios describe where fat sits, which predicts health risk better than weight alone. A waist under half your height is the simple target for the second ratio.
BMR and TDEE. Your result panel also estimates the calories you burn at rest and across the day. The calorie calculator page explains those two numbers in full, and our macronutrient calculator splits the calorie target into protein, carbs and fat.
Factors That Shift the Range
Age
None of the four formulas uses age, and the healthy BMI range does not change with age either. Age changes the interpretation instead: muscle mass falls and fat redistributes as the decades pass.
That is why two people with the same result can be given different advice. The number stays the same, but the sensible place inside the range moves.
Sex
At the same height, the formulas give men a higher base weight than women: 50 kg against 45.5 kg on Devine. The gap comes from higher average muscle mass, bone density and frame width in men.
In practice the difference is roughly 10 percent at average heights. It narrows as height rises, because the per inch additions are nearly equal for both sexes. The ideal body weight calculator keeps the two base weights separate for exactly this reason.
Muscle Mass
Muscle is denser than fat, so a muscular body weighs more at the same size and shape. The formulas were built on general population data and cannot see that difference.
If you train seriously, your healthy weight may sit above every number on this page. The lifter section below deals with that case directly.
Ethnicity and Risk Thresholds
Ethnicity changes where risk starts, and the direction matters. People of Asian origin tend to develop type 2 diabetes and cardiovascular risk at a lower BMI than people of European origin, not a higher one.
The WHO expert consultation recognised this by setting additional public health action points for Asian populations at a BMI of 23 (increased risk) and 27.5 (high risk). The full BMI cutoff table by ethnicity explains how those action points change the categories.
Older Adults
Height itself shrinks with age: losing about 1 to 2 inches by the age of 70 is common, and it is an average, not a rule. A smaller height raises BMI at the same weight, which is one reason older readings need care.
Research on older adults also suggests the lowest risk band sits slightly higher after 65, with a BMI up to about 27 associated with good outcomes. Sitting at the top of the healthy range is usually the sensible target at that age.
Is Ideal Body Weight Realistic If You Lift Weights?
Honestly, the formulas are a poor target for lifters. They were derived from insurance and dosing data on mostly sedentary populations between 1959 and 1983.
A trained lifter can be lean and healthy 5 to 10 kg above the formula cluster at the same height. Chasing the formula number would mean losing muscle, which is the opposite of the goal.
Use composition instead. The body fat calculator and a simple waist measurement judge a muscular body far better than any weight formula.
Limitations of IBW
The formulas are old. Devine, Robinson, Miller and Hamwi all date from 1964 to 1983 and come from insurance tables and drug dosing data, not from modern body composition research.
They also stop at the skin. No formula here can tell fat from muscle, bone or water, which is why this ideal body weight calculator always pairs its answer with a range and with composition measures.
Height has a floor in the math. All four formulas anchor at 5 feet and subtract per inch below it, so results grow less reliable the further below 5 feet you go; if you are shorter than 5 feet, lean on the BMI range in the chart instead.
Finally, these tools are for adults. Children, teenagers and pregnant women need percentile based or clinical assessment, not an adult formula.
Reference: CDC's guidance on healthy weight.
Frequently Asked Questions
In a Nutshell
An ideal body weight calculator gives you a range to aim at, not a verdict. The healthy BMI band sets the boundaries, the four formulas cluster inside it, and your frame size fine tunes the answer by plus or minus 10 percent.
Turn the target into a daily plan with ourmacro split calculator, and pair it with the healthy foods to eat weekly rotation. Every tool in this cluster sits on the health tools and calculators hub. Rerun the ideal body weight calculator after every 5 to 10 percent of body weight change, so the target you are chasing stays honest.